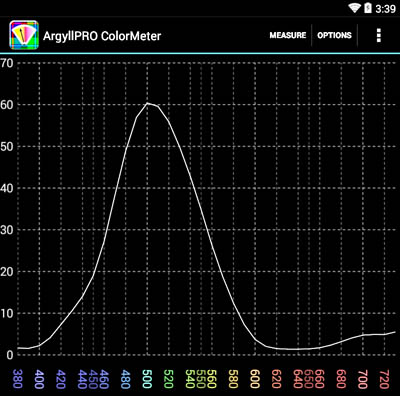
Spectral Graph
Access the Chromaticity Graph View from the Measurement View using
the Spectral Button.
The spectral graph is only available for measurements that have
spectral measurement information, and this is only possible from
spectral measurement instruments. See Instrument Capabilities.
Graph plots light wavelength on the X axis, and either absolute or
relative level on the Y axis.
Measurement Mode
|
Y Units
|
Emission
|
mW/(m2.sr.nm) |
Ambient
|
mW/(m2.nm)
|
Emission Flash
|
mW.s/(m2.sr.nm)
|
Ambient Flash
|
mW.s/(m2.nm)
|
Reflective
|
%/nm
|
Transmissive
|
%/nm
|
You can pinch zoom independently in the X and Y direction, and touch
scroll to focus on any detail of the graph.
Double tap to return to full view.
The wavelength values are color coded with an illustrative
wavelength color.
The axis numerical values will fade in or out of view during
zooming, maintaining a smooth transition with changes in scale,
and providing the ability to precisely measure the location of
features of the graph.
See Configuration
Options to enable or disable high resolution spectral
measurement mode on devices that support this.
Re-measure by tapping the Measure menu item.
The Options menu item pulls down a list of selection boxes
that allow choosing which measurements to plot.
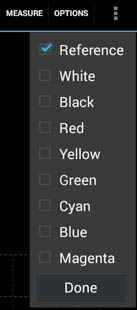
The last measurement is always plotted, and by default the Reference
Measurement is enabled.
The Primary color references may optionally be enabled.
Either touch the Done button, or somewhere else in the view
to dismiss the menu.
Use the Android Back button to return to the Measurement
View.